I’ve mentioned in a previous post how recent versions of C#8, along with some reputable code analysers have helped developers improve the quality of their code.
One of those analysers is from Sonar, a well known code quality company offering IDE, Cloud and on-premise integration with your code. I have top admit the first time I was introduced to SonarQube (Sonar’s on-premise offering), I was resistant as mature projects that have had few historical constraints in terms of code quality on top of numerous multi-developer contributions rarely score high on a Sonar Analysis.
Whilst there is no doubt that such an approach is best taken from day zero, Sonar is equipped to deal with mature projects by taking a ‘from now on’ approach and bench-marking its current status to ensure only new code is held to account.
In recent years, Sonar has released, and improved, its cloud offering and, best of all, provides a free cloud option for public open source projects. With that options available to me, I though it made sense to see how well one of my GitHub projects would fare under the scrutiny of the eye of Sonar.
Sonar not only integrates well with GitHub, it also allows you to use your GitHub account to register and login. To start off, you need to create an ‘organisation’ within Sonar to link to your GitHub account and select your repository as your project:

This will show you an option to link through to a Github project
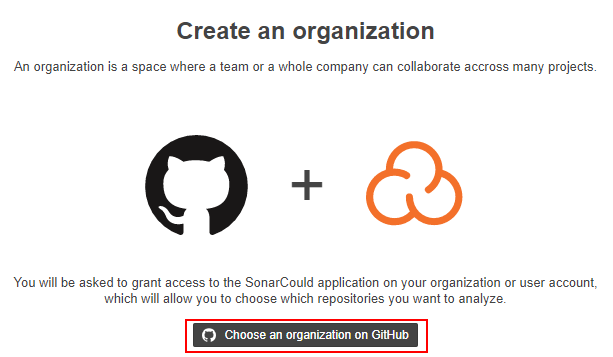
Click on ‘Choose an organization on GitHub’. This will redirect you to your GitHub account to be asked to authorise Sonar to access a selected repository:

Select your chosen repository and head back to Sonar.io. Select your new project and click ‘Setup’:

The next part was a little confusing to me as there were no options that allowed me to easily set up analysis for my dotnet core project through Azure DevOps:

Instead, what I had to do is use the newly created Sonar project to connect to from my dev environment and manually push a Sonar analysis up to Sonar first. First select the Manually option above, then **Other** and **Windows** (if you are running on Windows).

If using VS Code, you can install the dotnet sonar scanner tool from a bash terminal easily enough. For VS 2019 you can either use the Preview (at the time of writing) to get terminal or simply download the tool from the Sonar page and setup your PATH env variable:
dotnet tool install --global dotnet-sonarscanner
You also need Java SE installed on your system and to setup a PATH env to it. Using a VS Code bash terminal, you can easily create a JAVA_HOME environment variable:
# be sure to use the correct installation location for your install
export JAVA_HOME=C:\Program Files\Java\jdk-13.0.2
# check the path
echo $JAVA_HOME
At this point, I have to admit that a number of sources suggest a variety of permutations of how to perform a local sonar scan on your system. And none of them worked for me in totality. Instead I had to roll with a few punches and ended up with a knocked together set of options that got me through. For you it may be different but here’s my set up:
- Dotnet Core 3.1/ Dotnet Standard projects
- Two Test projects
- VS Code bash terminal
- Working directory at the same level as my sln file
- All source (including tests) in a src folder


For the above set up, here’s the list of commands that worked for me:
# begin the scan
$HOME/.dotnet/tools/dotnet-sonarscanner begin \
-o:"agiletea" \
-k:"agiletea_AgileTea.DocumentDb.Persistence" \
-d:sonar.sources="src" \
-d:sonar.exclusions="**/*Tests/**" \
-d:sonar.tests.inclusions="**/*Tests/**" \
-d:sonar.host.url="https://sonarcloud.io" \
-d:sonar.login="<Your Sonar PAT>"

# build sln in release config
dotnet build --no-incremental --configuration Release

# run tests
dotnet test --no-build --configuration Release

# end analysis and push to Sonar
$HOME/.dotnet/tools/dotnet-sonarscanner end -d:sonar.login="<Your Sonar PAT>"
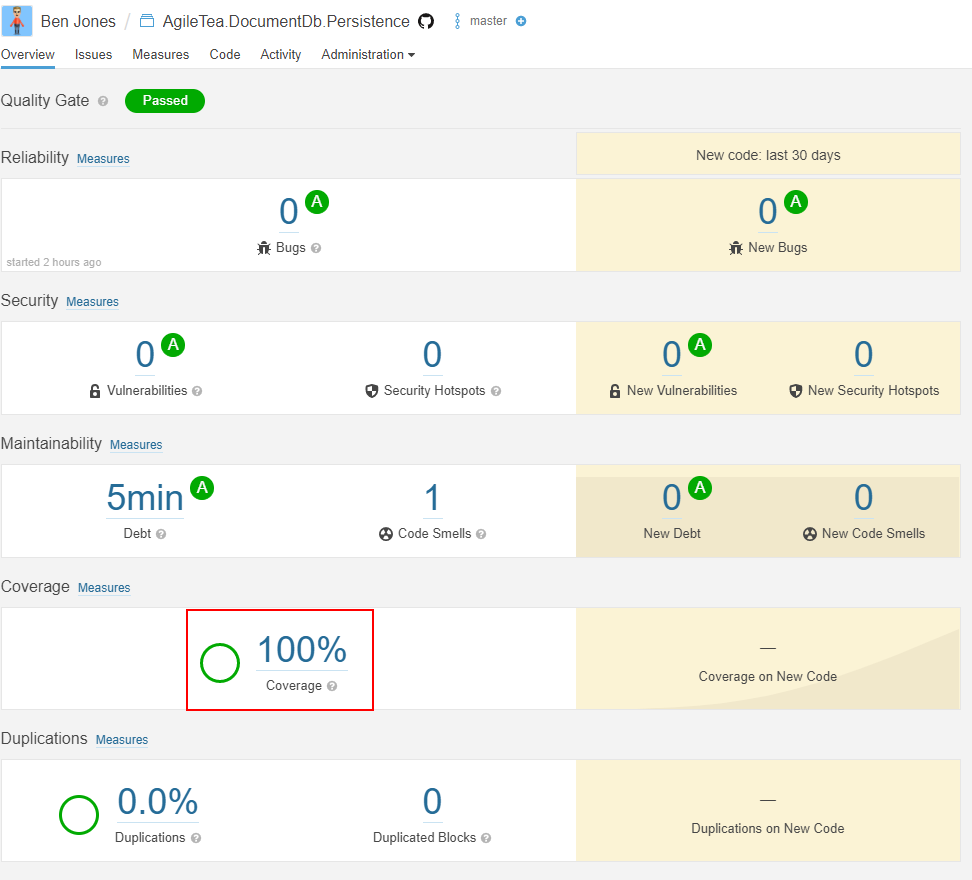
Once run, you can then review the outcome in Sonar:

You will notice that code coverage is reported as 0% which is incorrect. We need to use a code coverage tool within our test run to create the code coverage report. To get a code code coverage report for Sonar we need to use the Coverlet.MsBuild package with an OpenCover report format. For local use, we can install the dotnet report generator tool, and for Azure DevOps we can use the Cobertura format.
Install-Package coverlet.msbuild -Version 2.8.0
Test out local test coverage
dotnet build --no-incremental --configuration Release

dotnet test --no-build \
--configuration Release \
-p:CollectCoverage=true \
-p:CoverletOutputFormat=cobertura \
-p:CoverletOutput=./TestResults/Coverage/
You should see an output in the terminal window similar to below:

Install the Report Generator Tool for local code coverage reports:
dotnet tool install --global dotnet-reportgenerator-globaltool --version 4.1.1
Now execute the report generator for the given cobertura coverage reports:
$HOME/.dotnet/tools/reportgenerator \
-reports:./**/coverage.cobertura.xml \
-targetdir:./CodeCoverage \
-reporttypes:HtmlInline_AzurePipelines
If successful, you should see a new CodeCoverage folder at root level within which you will find a bunch of htm files, include an index.html. Open up the index page for your report:

Let’s test this out with a manual sonar scan to confirm if we can get the coverage reports up to our Sonar Project analsysis:
# begin the scan
$HOME/.dotnet/tools/dotnet-sonarscanner begin \
-o:"agiletea" \
-k:"agiletea_AgileTea.DocumentDb.Persistence" \
-d:sonar.sources="src" \
-d:sonar.exclusions="**/*Tests/**" \
-d:sonar.tests.inclusions="**/*Tests/**" \
-d:sonar.cs.opencover.reportsPaths="**/*Tests/TestResults/Coverage/coverage.opencover.xml" \
-d:sonar.host.url="https://sonarcloud.io" \
-d:sonar.login="<You Sonar PAT>"

# build sln in release config
dotnet build --no-incremental --configuration Release

# run tests
dotnet test --no-build \
--configuration Release \
-p:CollectCoverage=true \
-p:CoverletOutputFormat=cobertura%2copencover \
-p:CoverletOutput=./TestResults/Coverage/

# end analysis and push to Sonar
$HOME/.dotnet/tools/dotnet-sonarscanner end -d:sonar.login="<Your Sonar PAT>"
HINT keep an eye out for any warnings in your last Sonar analysis command – this is where you will be alerted if certain report files cannot be located which will result in an inaccurate analysis. One such warning I got was about the coverage file:
WARN: Could not find any coverage report file matching the pattern './**/coverage.opencover.xml'
Once you have successfully generated your reports and completed the Sonar scan, you should now see the Sonar Project overview update to reflect this.
In my next post, I’ll be taking these tools and commands and pushing them into my azure devops pipeline to get them automated.
0 Comments