Ensuring you have logging enabled for your application has always been a high priority but even more so now, in the age of DevOps, that a comprehensive solution is in place to support any pro-active approach to managing issues in Production. Splunk is a popular logging option, historically perhaps, for enterprise level organisations but the advent of cloud and consideration for lower volumes has brought it into the mass market for smaller companies.
As with any potential offering though, evaluating it as an option can be time consuming and potentially costly to set up if you need new hardware or want to keep your existing set up clean.
This is where Docker provides an excellent option, possibly as a by-product of its intention. Setting up such systems in minutes with no lasting footprint on the host machine is priceless. You can find the docker image on Dockerhub here, although, assuming you have installed the necessary Docker Desktop, you’ll likely allow your docker run command to pull it down the first time.
A couple of points worth noting:
- If you want to use the Http Event Collector (HEC) – and that’s quite likely, you’ll need to expose its port (8088) as well.
- You need to accept the license in order to start the instance so doing this as an environment variable within your docker run command makes sense
- You need to set up the default admin account password as well. It must adhere to Splunk password policy of being a minimum of 8 characters, include a number, lowercase, uppercase and non alpha-numeric character. If you don’t you’ll see your instance exits as soon as you try to run it.
- It’s a good idea to kick start the service as part of your run command to save having to open a bash console. You can then navigate straight to the web portal on port 8000.
Here’s my run command, leaving the existing ports mapping to the same:
docker run -d -p 8000:8000 -p 8088:8088 -e SPLUNK_START_ARGS==--accept-license -e SPLUNK_PASSWORD=ABCdef123! --name mysplunk splunk/splunk:latest start
On first start it can take some time so you may find navigating to http://localhost:8000 does not response straight away. You can check the status of the container with a simple docker ps -a command to bring up your containers and see if the Splunk container has reached a healthy (ready) state.
Once you have your Splunk container up and running you can login as admin.
Posting events to the HEC
This next part assumes you have expose the internal port 8088 to enable posting to Splunk’s HEC.
To do this you need to create an authentication token to use within the headers of any request you send to the HEC.
From the Settings menu (near top right), click on the Data inputs link under the Data heading. Around 2nd in the list should be the HTTP Event Collector. Click on the + Add new link on the right hand side:

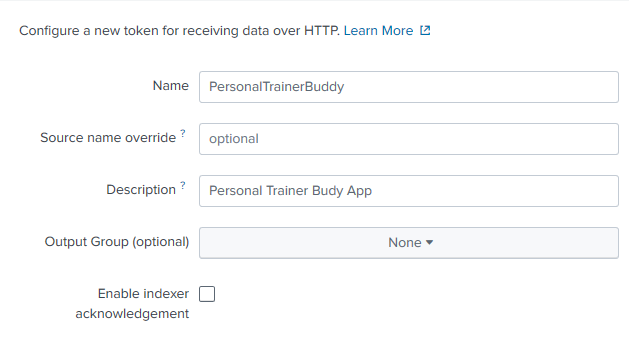
Provide at least a name (no spaces) for your app and then click next
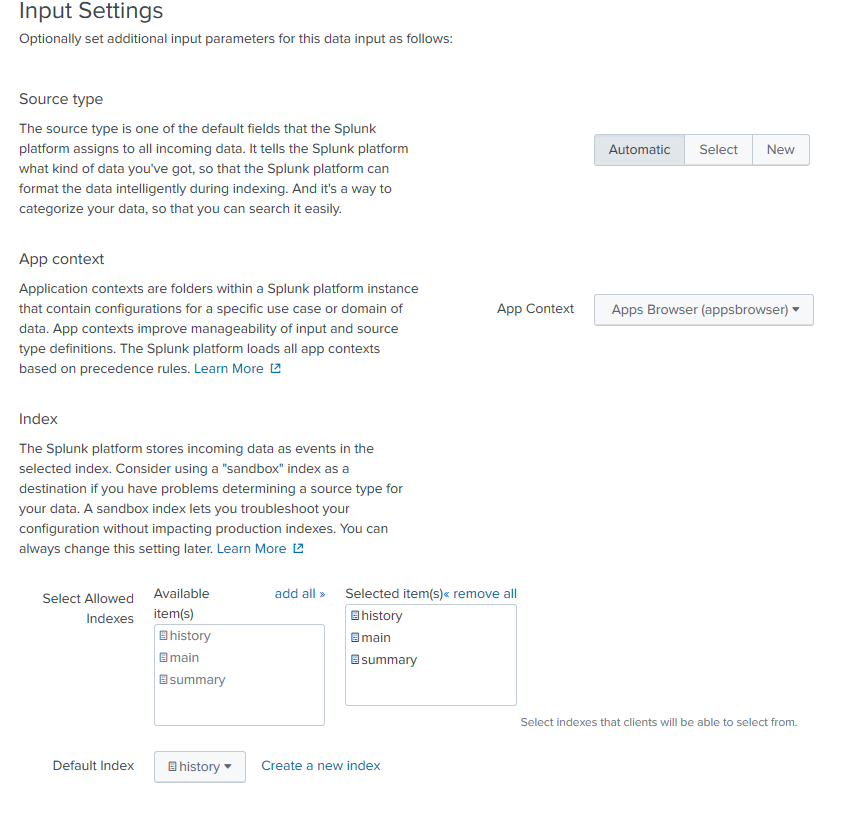
You can leave the next part as its defaults although you might want to add some indexes (indices?!) as an option were this production. Then click Review and then Submit
Your token value will then be displayed – in a disabled textbox that allows selection for you to copy and paste but with no caret so it’s not the most intuitive or clean approach. Save your new token somewhere safe.

Before you jump in to test this, you need to Enabled Tokens for the HEC. Head over to http://localhost:8000/en-GB/manager/search/http-eventcollector and look for the exclamation mark next to the GHlobal Settings button:

Click on Global Settings and select the Enabled button against All Tokens

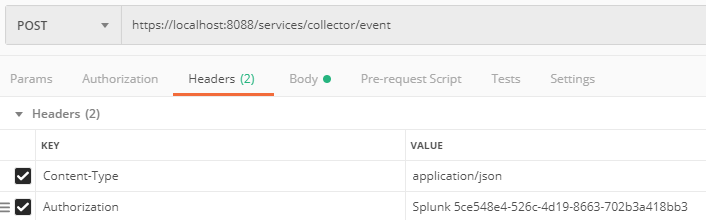
Next, it’s a good idea to test it out with a call through Postman. The url you need to post to will be your localhost + port + “/services/collector/event”. You need to set the content type to application/json and add in an Authorization header (do this within the Headers section as there is no ‘Splunk’ option in the Authorization options). You need to add ‘Splunk ‘ in front of your authorization header:
You body then needs to include and event object, but can otherwise be some simple text for testing purpose:
{
	"event": "hello world"
}
You may find your first attempt does not get a response and POstman returns the following:

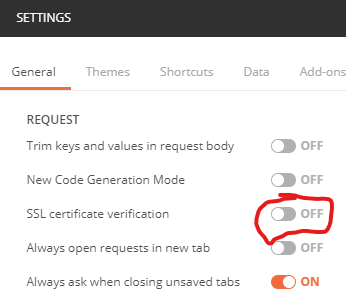
This is most likely because of the SSL certificate used by the Splunk instance within the container. It won’t be trusted and the SSL certificate verification will fail. To bypass this, you wil need to turn off this check in Postman settings:
Try this again and you should get a 200 OK response back.

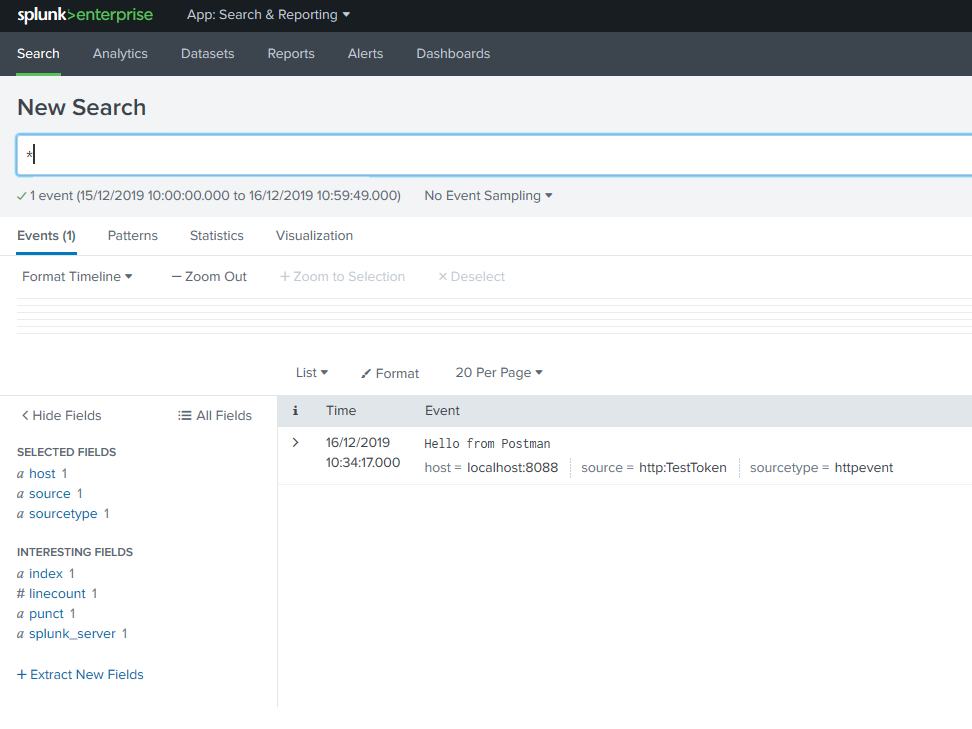
Note that turning off SSL verification in code is not a Production option and I’ll come to issues with sending log events from your code to a Splunk docker instance in the next post. For now, let’s see the results. Search for ‘*’ in a new search leaving the date span as Last 24 hours and you should see something akin to the following:
The next step is to try and replicate the same functionality in code.
0 Comments